SKA-3 Experiment

SKA-3 instrument consists of two energy-angle (EA) electrostatic analyzers and two energy-mass (EM) time-of-flight analyzers. The aim of the experiment is to measure spectra and anisotropy of electrons and ions (namely, H+, He+ and O+) within energy ranges 0.03 eV - 15 keV (for EA analyzers) and 30-500 keV (for EM analyzers).

Here you can find more details about SKA-3 instrumentation set.


Upward high-energy field-aligned electron beams above the polar edge of auroral oval.

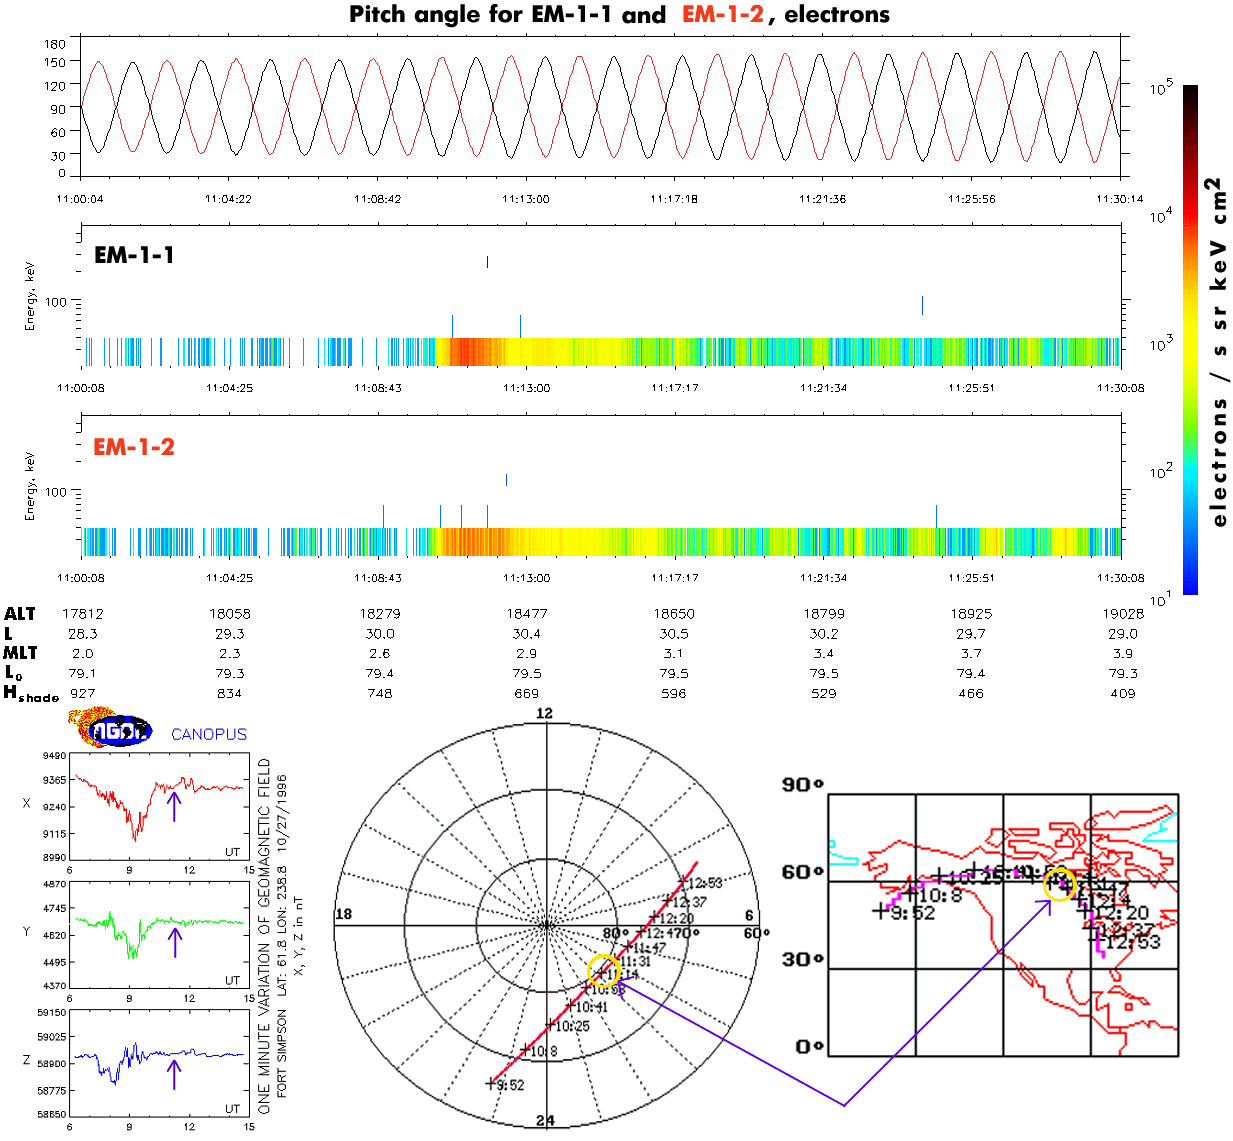
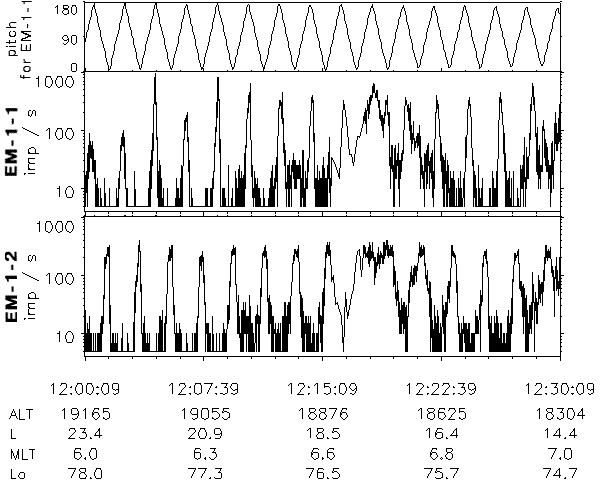
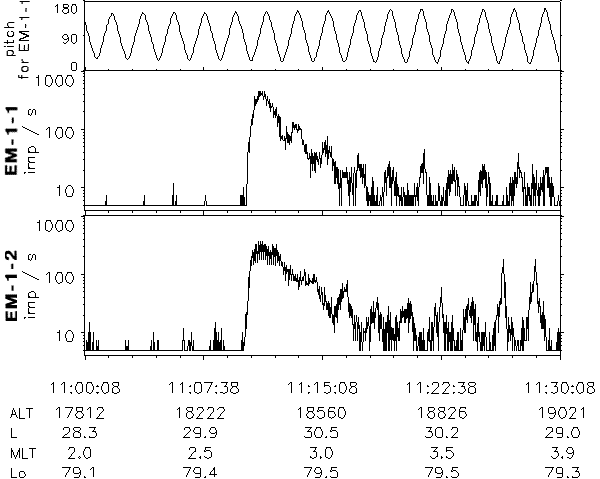
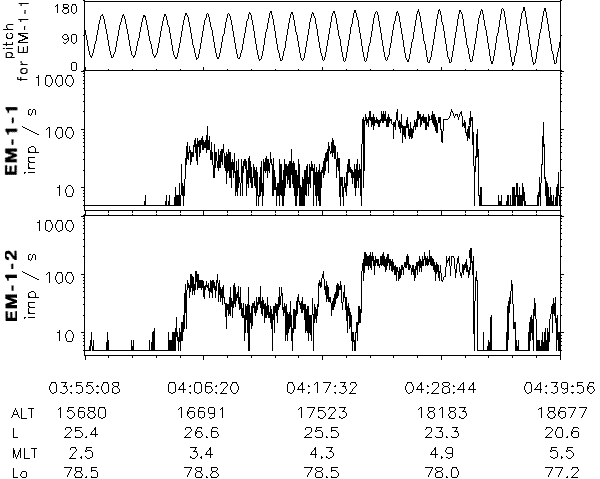
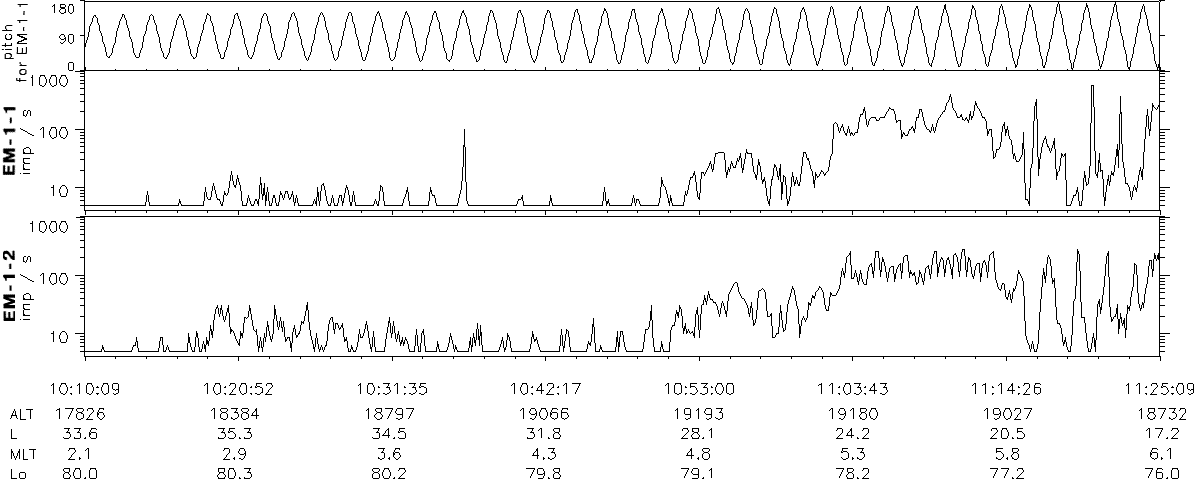
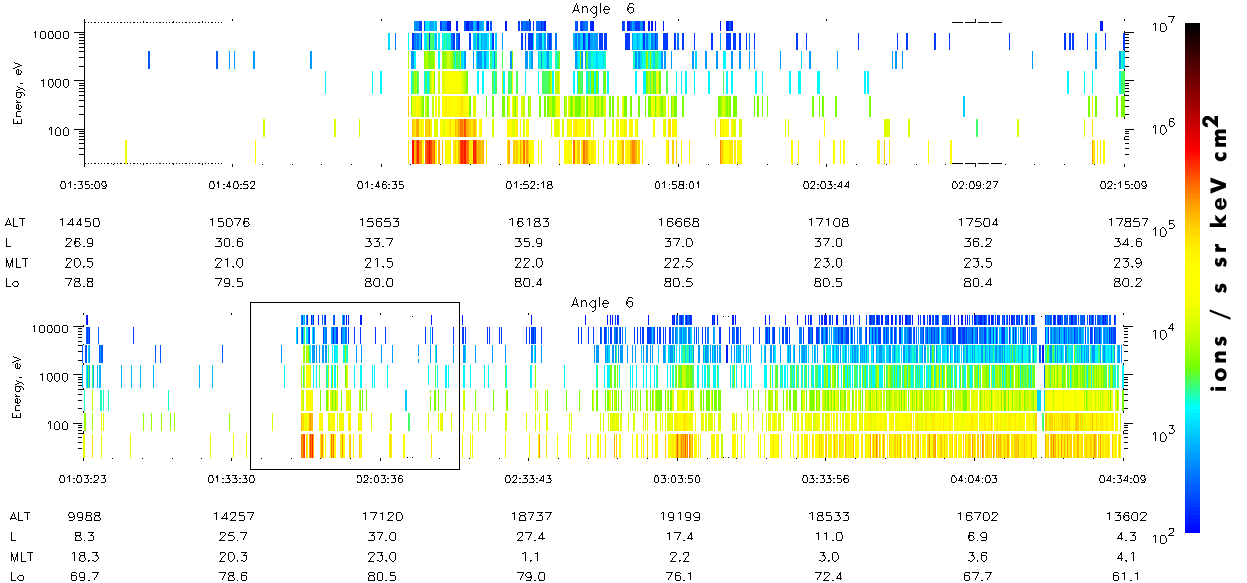
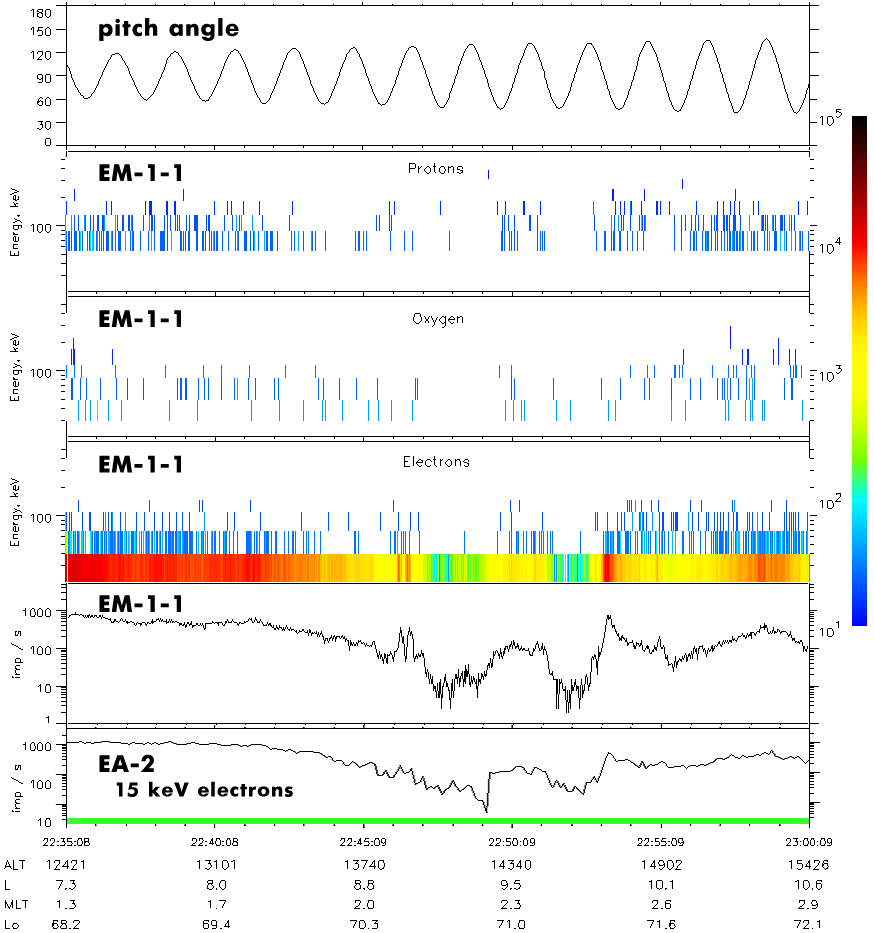
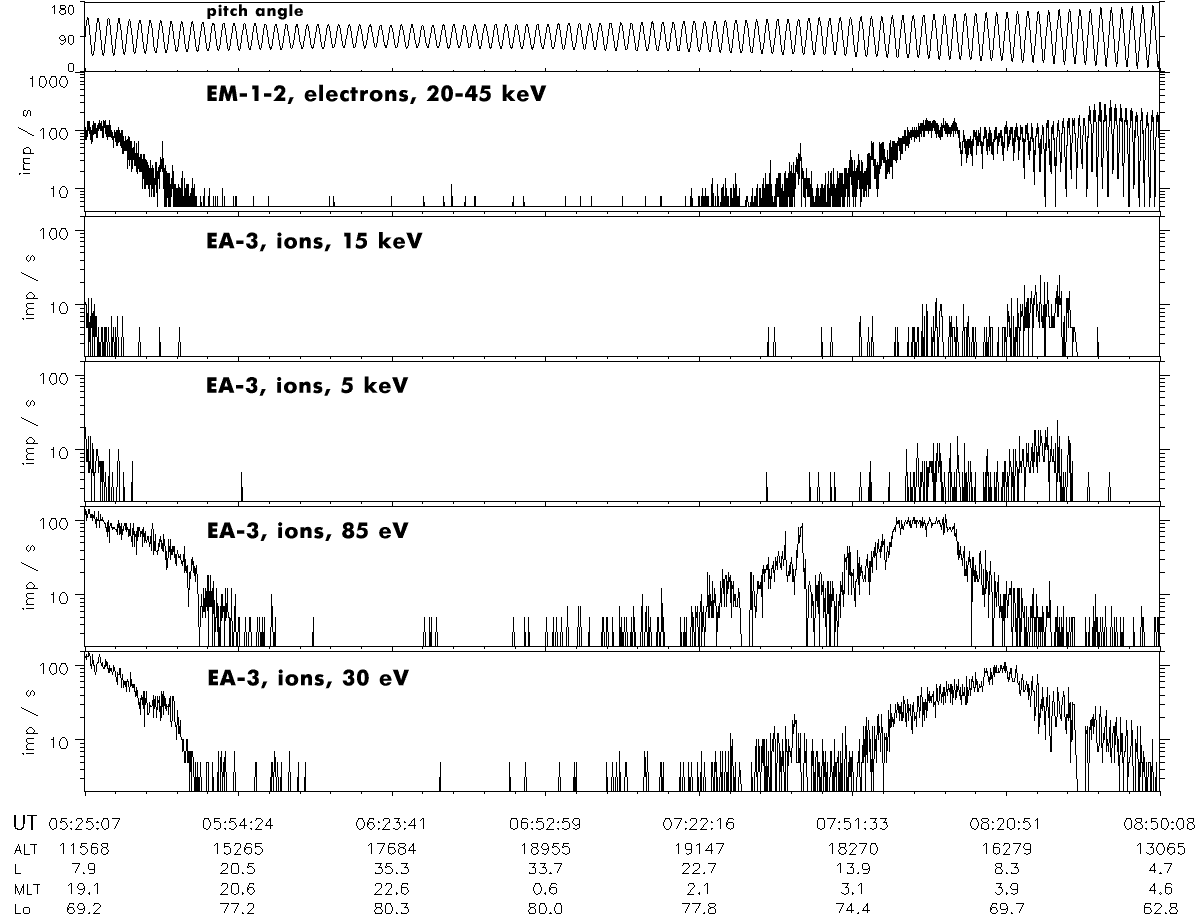
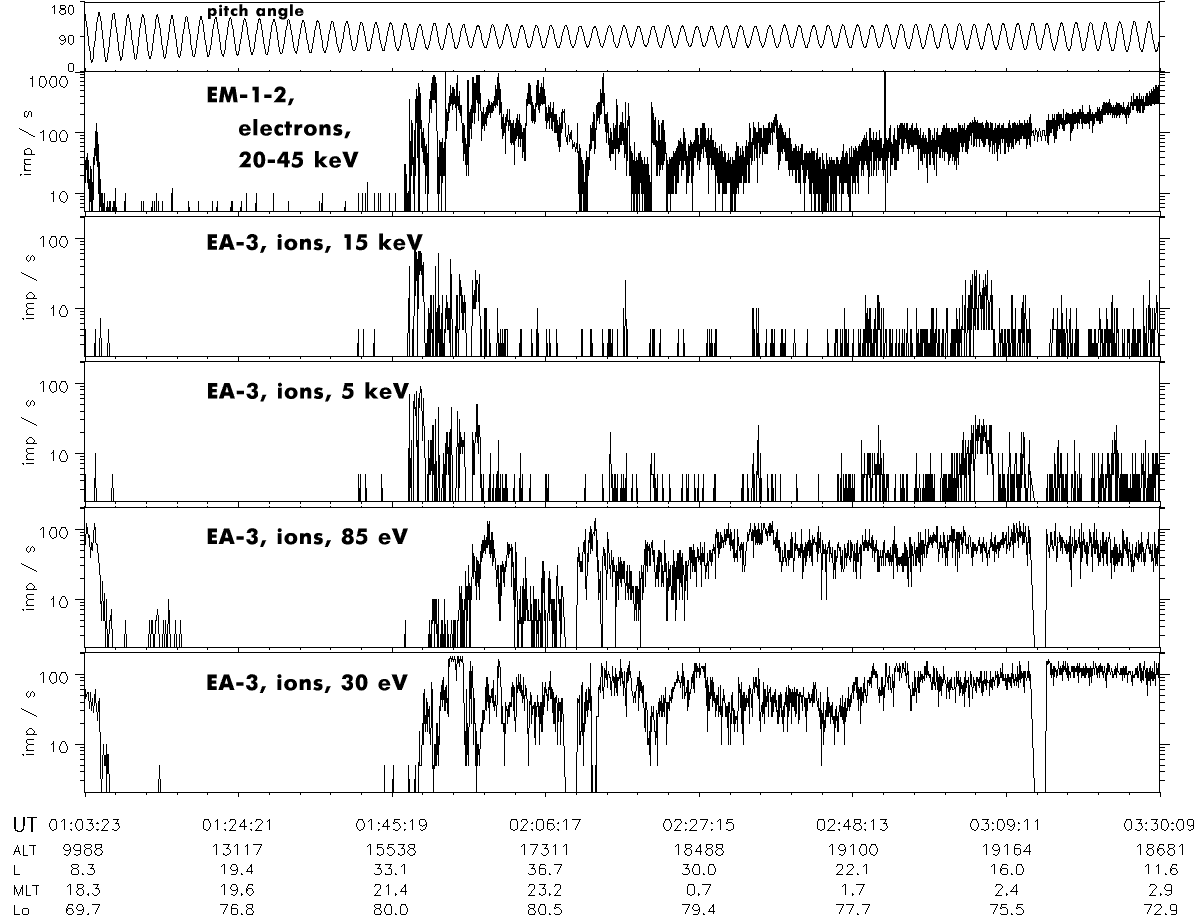
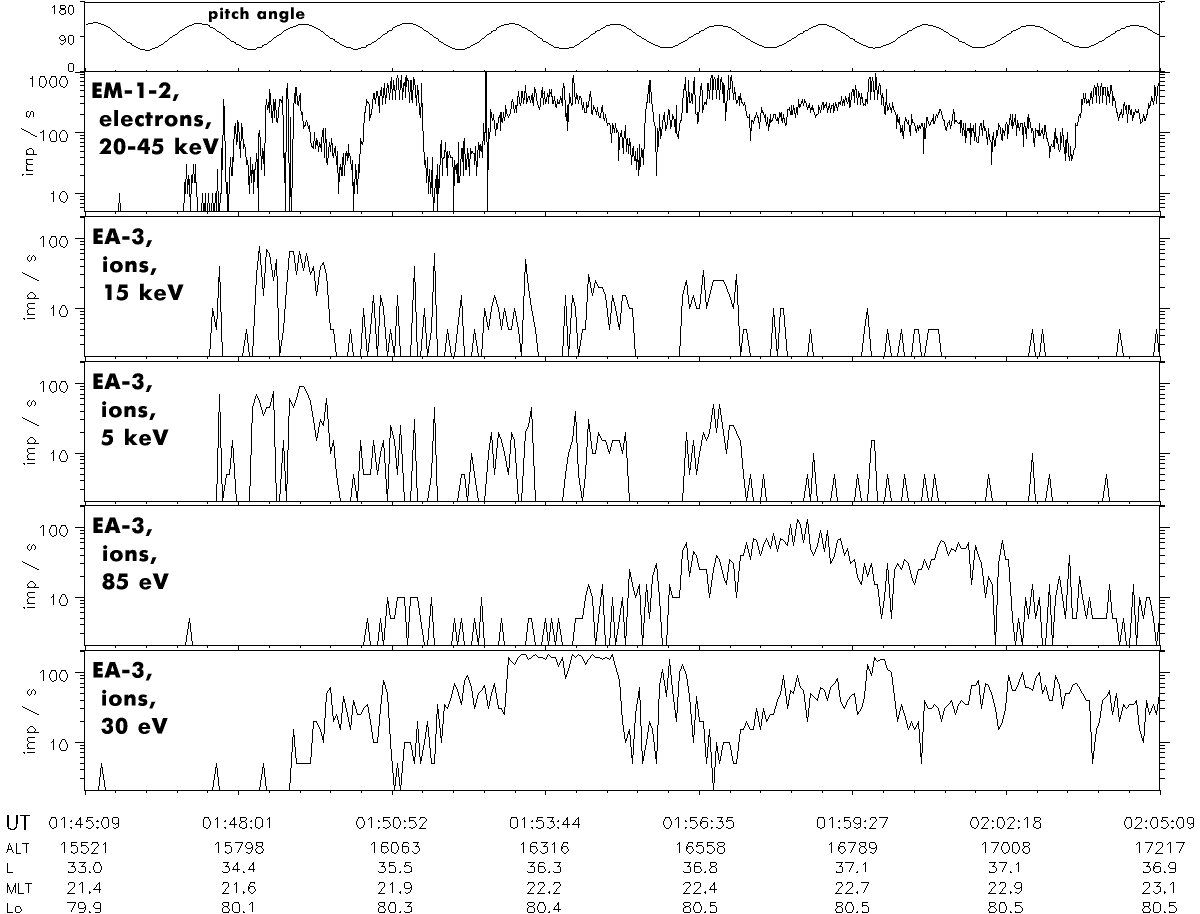
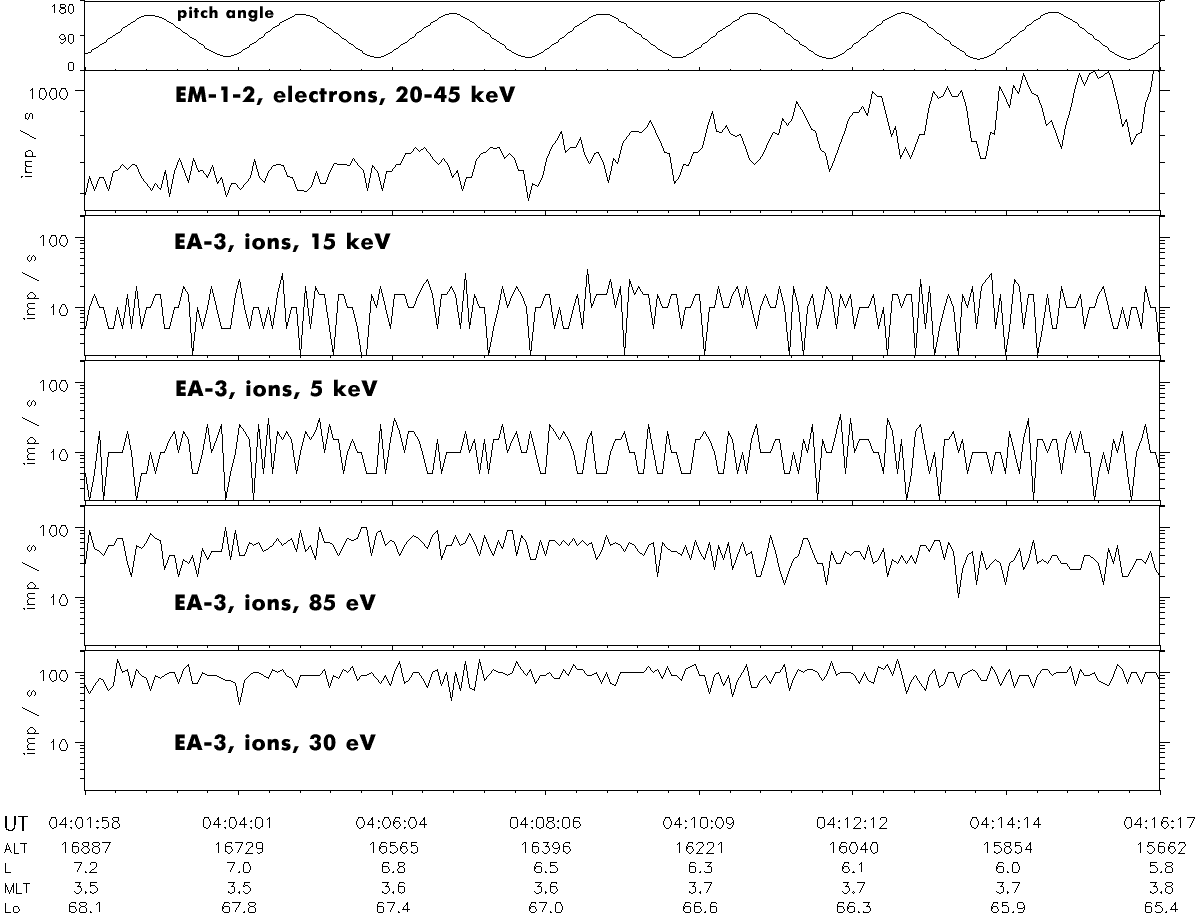
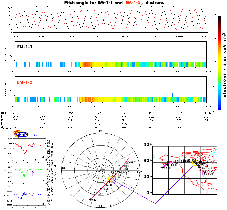
A new phenomenon was found at the polar edge of the auroral oval in the postmidnight - morning sectors: field-aligned (FA) high-energy upward electron beams in the energy range 20 - 45 keV at altitudes about 3 RE, accompanied by bidirectional electron FA beams of keV energy. The ILAT-MLT location of the beams is consistent with a region of downward FA current (Region I), although the exact correspondence is still not proved by direct measurements. The beam intensity often reaches more than 104 electrons/s·sr·keV·cm2, and the beams are observed for a relatively long time (~3·102-103 seconds), when the satellite at the apogee moves slowly in the ILAT-MLT frame. A qualitative scenario 
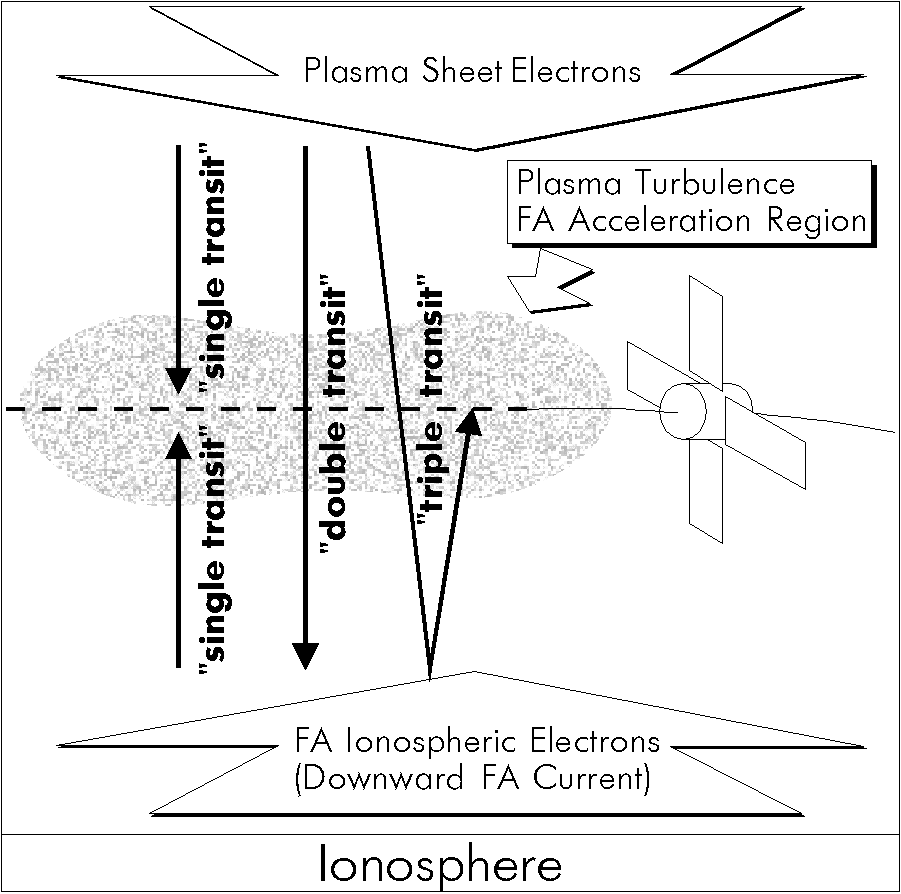
of the acceleration mechanism is proposed, according to which the satellite is in between the bidirectional acceleration regions where a stochastic FA acceleration is accomplished by waves with fluctuating FA electric field components in both directions. The lower-hybrid, ion-cyclotron, ion-sound waves, Langmuir and/or lower-hybrid cavitons, or ion holes, seem to be possible candidates for such waves.


Below are some examples of the upward beam observations plotted in counts-per-second vs UT.


Case 218 Case 247 Case 250 Case 251


Event detected on the 11th of December, 1996.

On the picture data from EA-3 analyzer are shown. The flux intensification is seen at 4:48 UT. Along with SKA-3, this event was detected by the DOK-2 instrument of the Auroral Probe, and simultaneously by the DOK-2 instrument onboard the Tail Probe.

Pictures below correspond to various intervals of the observed event.


SKA-3 and UFSIPS intrument of the Auroral Probe: simultaneous observations.

Figure captions

top left
satellite's trajectory in geomagnetic frame (blue coloured), UFSIPS scan location and observation moment (red coloured), interval of the SKA-3 observations (green coloured)
top center
a view of the Nothern polar region at the moment of UFSIPS observations, the scan location is red coloured.
The UFSIPS measurements (in particular, scan view adjustment) were performed using the model calculations carried out by V. Prokhorenko (http://www.iki.rssi.ru/vprokhor/auroral.htm).
top right
particle data from SKA-3, intensity is colour-coded (particles / s·sr·keV·cm2)
bottom left
magnetogram from Kiruna ground observatory, obtained through WWW (http://www.ngdc.noaa.gov)
bottom right
intensity profiles of the 1356 Å 1304 Å emission lines observed by UFSIPS (along the scan)


And for the very last:

we've got the really beautiful picture of "almost quiet" auroral oval.

Enjoy!


HTML by Vladimir Stepanov