The Wave Nature of Light
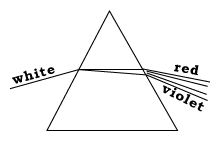
Prisms and slits can be used to filter light, leaving only the "monochromatic" light of a single, well defined spectral color. Studies with such light have shown that light propagates like a wave. Its wavelength, the distance from crest to crest, is rather tiny, typically 0.5 micrometers or microns (millionths of a meter).
[We postpone addressing the question "crest of what? " Early physicists did not know the answer, either--they just knew that when two crests overlapped, the light was brighter, while when crest met "valley" (crest in the opposite direction), the waves cancelled each other, giving a darkening.]
The wavelength determines the extent to which a wave can be confined to certain locations. Because light waves are so short, we can also visualize a light wave limited to a well-defined beam. However, outlines begin to blur when we look at small objects through a powerful microscope, magnifying several thousand times, because light waves cannot define details smaller than their wavelength. That is where electron microscopes become useful, using not light but beams of electrons.
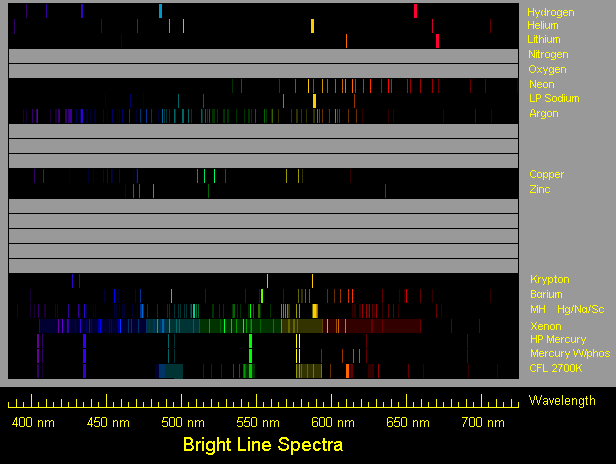
A variety of instruments allow physicists to actually measure the wavelength of light. The one most likely to be used by students is a diffraction grating, a plate ruled with fine parallel grooves, with a constant distance between each one and the next. Inexpensive plastic gratings are available, pressed from a metal grating and mounted on cardboard frames like photographic slides. The incoming wave resonates with the spacing between the grooves and some of it is deflected, by an angle which depends on the wavelength, and knowing the angle and the spacing allows the wavelength to be calculated. Thus gratings can separate a beam of light into its colors the way prisms do, and they are often used in spectroscopes.
[Lit from the side with a reflecting surface behind them, gratings will shimmer in many colors, making them a popular item of costume jewelry. The same process is responsible for the shimmering of laser disks used in recording music and computer data, which also contain many narrow parallel grooves.]
Spectra
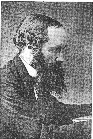
19th century scientists, in particular Robert Bunsen (1811-99) and Gustav Kirchoff (1824-87), observed and catalogued the spectra of many substances. That provided a tool for analyzing the composition of metals and other substances, still widely used.
The Sun, too, emits spectral lines. The ones noted first were dark lines (named Fraunhofer lines after their discoverer), suggesting increased absorption of light, not increased emission. Cool atoms absorb the same wavelengths as the ones they emit when hot--for instance, light from a filament bulb, shining through a tube with mercury vapor too cool to emit light, will develop dark lines at the same wavelengths as those emitted by hot mercury vapor. In the case of sunlight, it turned out that the absorbtion occured not in the Earth's atmosphere (as one might have guessed) but in the Sun's.
In addition, however, sunlight also contains many bright emission lines, characteristic of hydrogen, calcium and other elements. One yellow line, discovered in 1868, was first identified as the yellow line of sodium, but it did not have the proper frequency and did not fit the spectrum of any other known substance. The British astronomer Norman Lockyer finally proposed that here was a new substance, unknown on Earth, and he was right: "helium" (from "helios", the Sun) was identified in terrestrial material by William Ramsay in 1895 and was later isolated by him.
Further Exploration
http://umbra.nascom.nasa.gov/images/ is a useful compilation of solar information, including the most recent images of the Sun available from various observatories. The images are taken through filters which isolate narrow ranges of color emitted by selected substances (i.e. "spectral lines"), and show much detail about active solar regions.
Questions from Users: